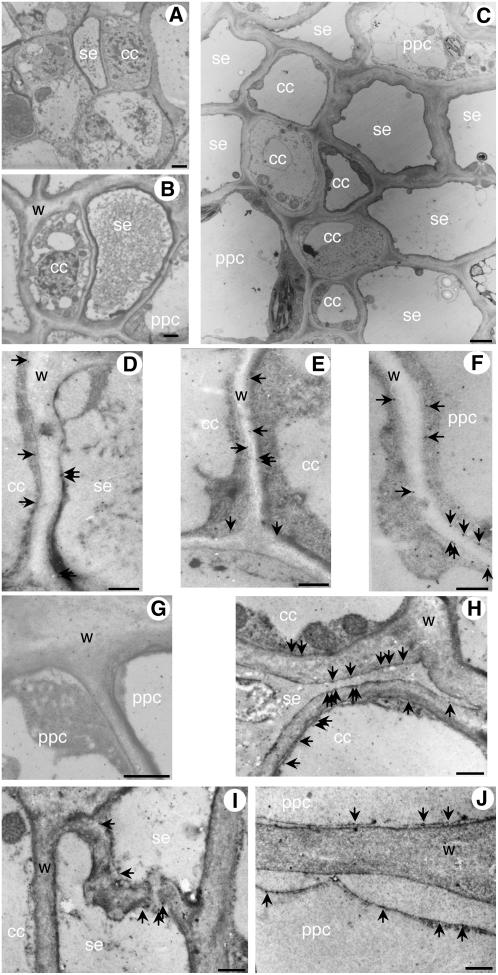
Figure 11.
Localization of AgMaT2 protein in the different phloem cell types in thin sections (60–80 nm). Ultrastructural features of the conducting zone in leaflet (A) and petiole (B and C) are presented. Sections are from leaflet major vein (A, D–F) and petiole vascular bundle of celery mature leaf (C, G–J). The immunolabeling by gold particles of AgMaT2 proteins in the plasma membrane is indicated by arrows. A control was made where the primary antibody directed against AgMaT2 was omitted (G). cc, CC; ppc, phloem parenchyma cell; se, SE; w, wall. Scale bar = 0.5 μm.

