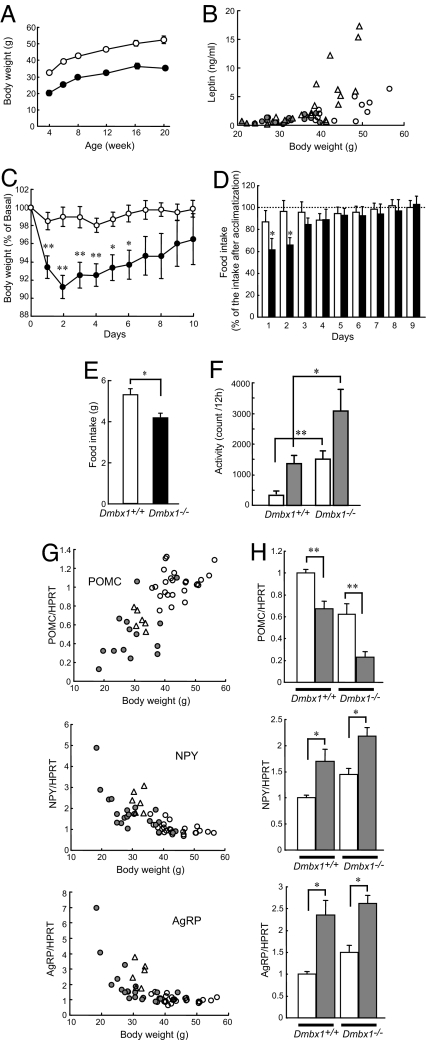
Fig. 1.
Phenotype of Dmbx1−/− mice. (A) Growth curves of Dmbx1+/+ (white circles) and Dmbx1−/− (black circles) mice. The data are from 7–11 male mice for each time point. (B) Relationship between body weight and serum leptin levels in Dmbx1+/+ mice (white circles, male; white triangles, female) and Dmbx1−/− mice (gray circles, male; gray triangles, female) at 16 wk of age. (C) Changes in body weight after isolation. Body weight of Dmbx1+/+ (white circles; n = 12) and Dmbx1−/− (black circles; n = 11) female mice are expressed as a percentage of those on the day of isolation (day 0). *, P < 0.05; **, P < 0.005 (vs. Dmbx1+/+). (D) Changes in food intake after isolation. Food intake of Dmbx1+/+ female mice (white columns; n = 12) and Dmbx1−/− female mice (black columns; n = 11) is expressed as a percentage of the average food intake after a 4-wk acclimatization period. *, P < 0.05 (vs. Dmbx1+/+). (C and D) The data are from female mice at 24–28 wk of age. (E) Daily food intake after the acclimatizing period of Dmbx1+/+ male mice (white column; n = 16) and Dmbx1−/− male mice (black column; n = 20) at 24–28 wk of age. *, P < 0.002. (F) Locomotor activity. Spontaneous locomotor activity of Dmbx1+/+ (n = 9) and Dmbx1−/− (n = 7) male mice at 28–32 wk of age is expressed as the count of infrared-beam splits during a 12-h time period during the light phase (0800–2000 hours; white columns) and dark phase (2000–0800 hours; gray columns). *, P < 0.05; **, P < 0.005 (vs. Dmbx1+/+). (G) mRNA expressions of neuropeptides in the hypothalamus. Relationship between body weight and mRNA expression levels in the hypothalamus of Dmbx1+/+ mice fed ad libitum (white circles), food-restricted Dmbx1+/+ mice (white triangles), and Dmbx1−/− mice (gray circles). (H) Changes in mRNA expression levels in the hypothalamus by fasting (n = 6–12). *, P < 0.05; **, P < 0.005 (vs. Dmbx1+/+). (G and H) The data are from female mice at 28–32 wk of age.

