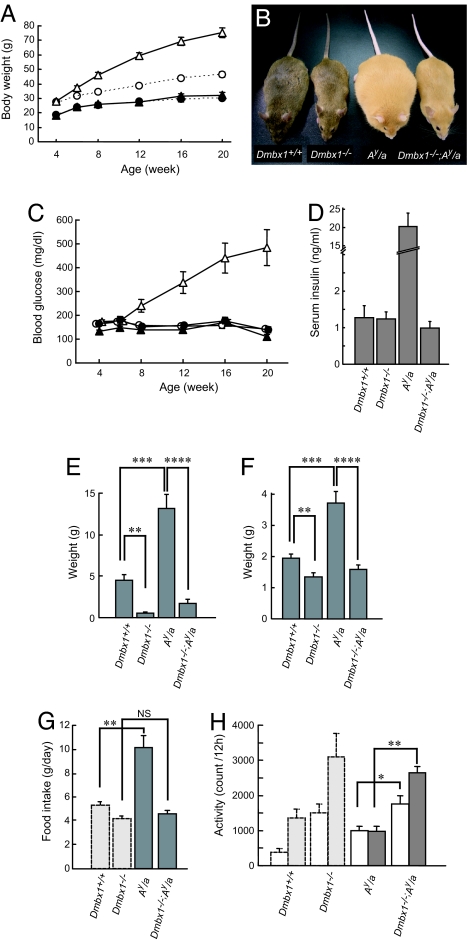
Fig. 2.
Phenotype of Dmbx1−/−; Ay/a mice. (A) Growth curves of Dmbx1+/+ (white circles), Dmbx1−/− (black circles), Ay/a (white triangles), and Dmbx1−/−; Ay/a (black triangles) male mice. The dotted lines for Dmbx1+/+ and Dmbx1−/− mice are the same as in Fig. 1A. (B) Representative photographs of each genotype. (C) Blood glucose levels of Dmbx1+/+ (white circles), Dmbx1−/− (black circles), Ay/a (white triangles), and Dmbx1−/−; Ay/a (black triangles) male mice. (D) Serum insulin levels in mice at 16 wk of age. The data are from 7–11 male mice for each genotype. (E and F) Tissue weight [retroperitoneal fat (E) and liver (F)] of Dmbx1+/+ (n = 7), Dmbx1−/− (n = 6), Ay/a (n = 7), and Dmbx1−/−; Ay/a male mice (n = 6). (G) Daily food intake of Ay/a (n = 8) and Dmbx1−/−; Ay/a (n = 12) male mice at 28–32 wk of age. (H) Locomotor activity. Spontaneous locomotor activity of each genotype is shown. The data are from 7–9 male mice at 28–32 wk of age for each genotype. (G and H) The results of Dmbx1+/+ and Dmbx1−/− mice (light gray columns, same as in Fig. 1 E and F) also are shown for comparison. *, P < 0.05; **, P < 0.005; ***, P < 0.001; ****, P < 0.00005; and NS, not significant.

