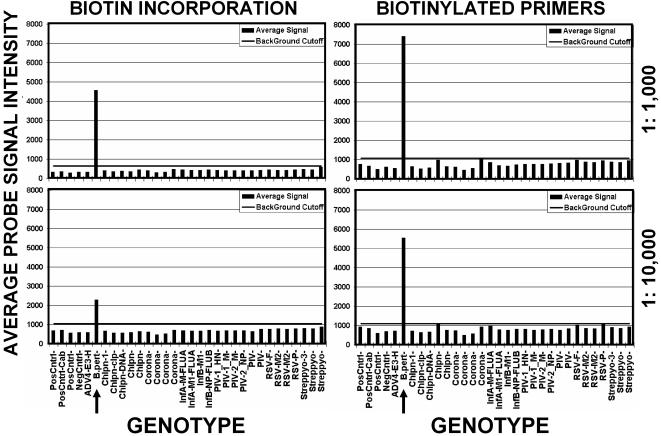
Figure 2. Comparison of assay sensitivity with target labeled by biotin-incorporation and biotinylated primers.
B. pertussis (B.pert, arrow) genomic DNA at 15 ng/ul was diluted to 1∶1,000 (top panels) and 1∶10,000 (bottom panels) and labeled either by biotin-incorporation (left panels) or with biotinylated reverse primers (right panels). The average of type-specific probe group signals in picoamps is shown at the left and identity of pathogen type-specific probe groups is shown below panels. The horizontal bar indicates the assay cutoff, which was determined by the mean value of negative control probes plus 3 standard deviations of the mean.

