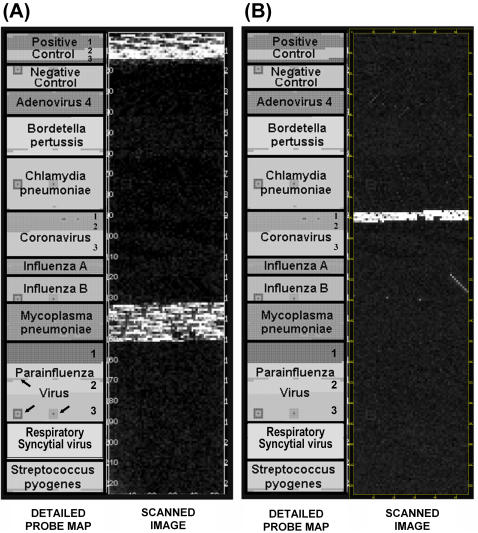
Figure 3. Pseudoimage of raw data from scanned chips illustrating Mycoplasma pneumoniae (A) and coronavirus 229E (B) detection.
The left panels (Probe Map) show the position of all pathogen-specific probes and include 3 sub-type probes for coronavirus and parainfluenza virus. Geometric shapes indicated by arrows are areas on the microarray dedicated to array quality control probes. Positive control target was included only with M. pneumoniae (A). Coronavirus probes are divided into three sections on the array: 1) Type 1, 2) Type 2, and 3) Type 3.

