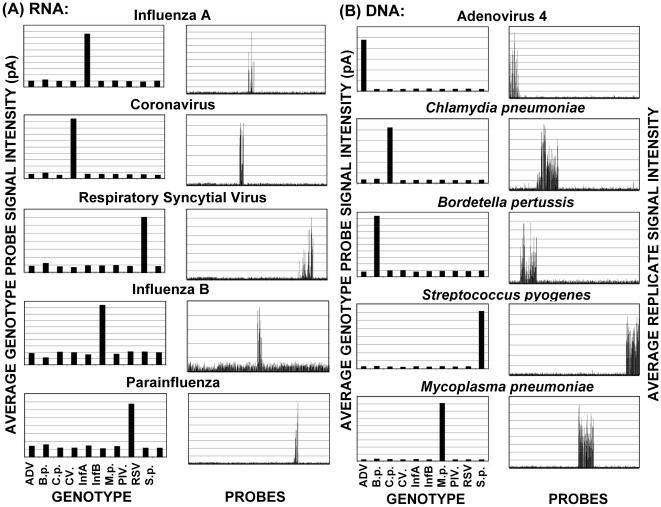
Figure 4. URI chip validation studies showing average RNA genome (A) and DNA genome (B) target signal intensity for the 10 upper respiratory pathogens studied.
The left panels (GENOTYPE) show the average genotype-specific probe signal in picoamps that is used to determine a genome identity. The right panels (PROBES) illustrate the average probe signal intensities of 12 replicates for each probe and also illustrate signal specificity for both positive and negative probes. Pathogens are ADV (adenovirus 4), B.p. (Bordetella pertussis), C.p. (Chlamydia pneumoniae), CV (coronavirus), InfA (influenza A), InfB (influenza B), M.p. (Mycoplasma pneumoniae), PIV (parainfluenza virus), RSV (respiratory syncytial virus), and S.p. (Streptococcus pyogenes) at nucleic acid concentrations described in Table 2.

