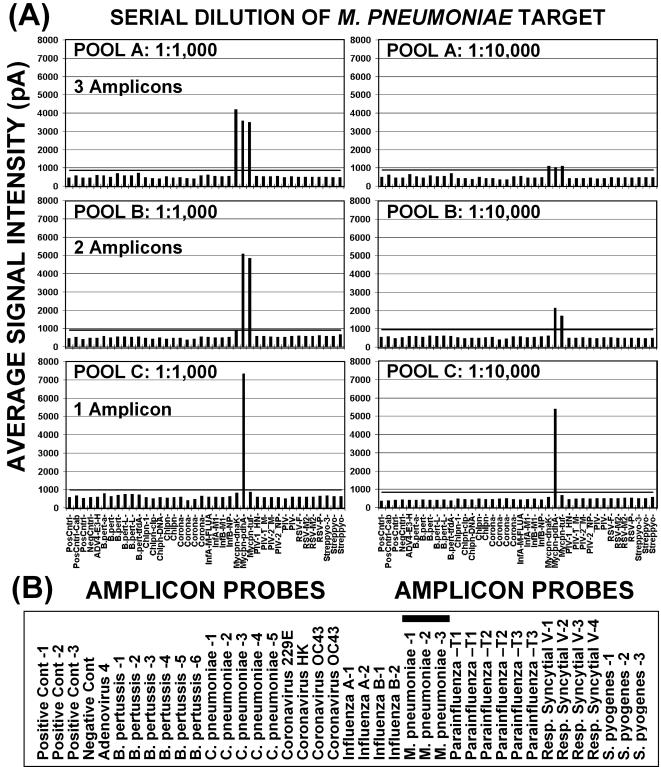
Figure 5. Comparison of assay sensitivity with primer pools 1A, 1B, and 1C.
Mycoplasma pneumoniae (M.p.) DNA, at 1 ng/ul, was serially diluted and amplified with primer pools 1A (3 M.p. amplicons), 1B (2 M.p. amplicons), and 1C (1 M.p. amplicon). Panels in (A) illustrate the sensitivity obtained with the 3 pools at M.p. DNA dilutions of 1∶1,000 (left) and 1∶10,000 (right). Average signal intensities in picoamps for each set of amplicon probes (vertical bars) are shown at the left. The horizontal bar within graphs indicates the assay cutoff (mean 3±SDM). The PCR amplicons analyzed for each pathogen are listed in panel (B) and the three M.p. amplicons are indicated by thick underline.

