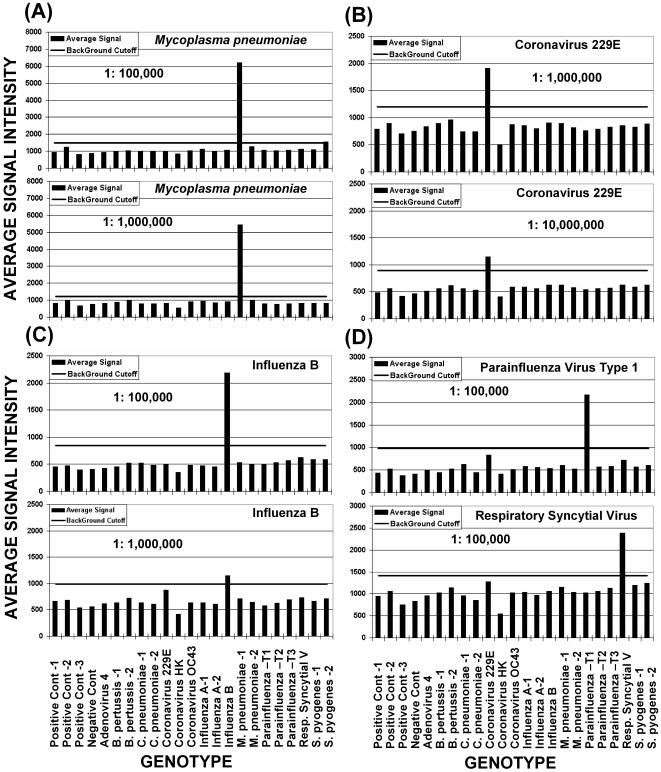
Figure 6. Results of sensitivity studies for Mycoplasma pneumoniae (A); coronavirus 229E (B); influenza B (C); and PIV 1, and RSV (D).
Vertical bars indicate the mean signal intensities in picoamps for positive genotypes (above cutoff bar) and negative genotypes (below cutoff bar). Horizontal bars indicate the assay cutoff, which is based on the mean of the negative control probes, plus 3 standard deviations of the mean. Relative probe electrochemical signal intensities in picoamps are shown to the left and probe identities are shown below. The identity of the pathogen tested and the dilution factor are shown on each graph. Beginning target nucleic acid concentrations are shown in Table 2.

