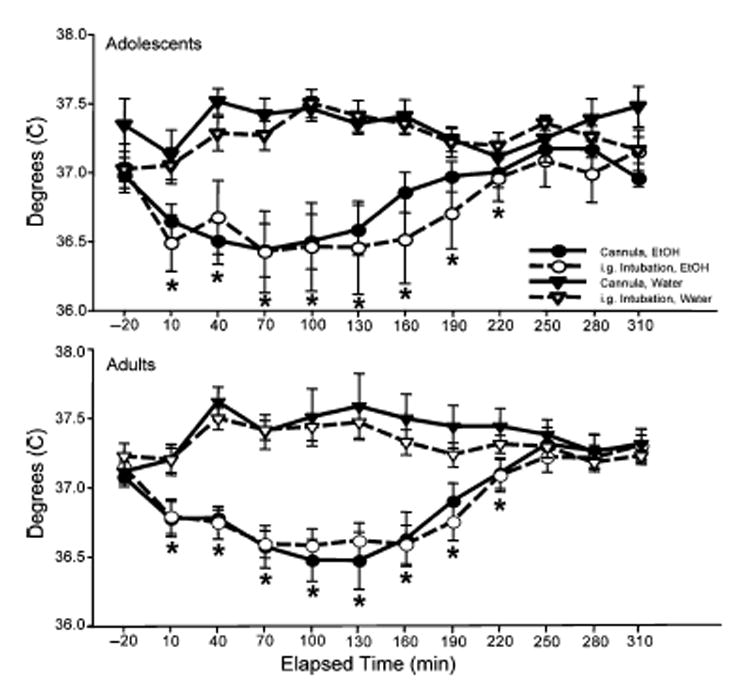
Fig. 1.

Adolescent (top) and adult (bottom) body temperature recorded by telemetry implants in Experiment 1 and expressed as °C. Data are shown in 30 min time bins with the point of ethanol administration labeled as “10.” *Significant difference (p<0.05) between animals of both ages that were administered ethanol and those that were administered tap water (based on Fischer’s post hoc analysis of the significant time×drug interaction).
