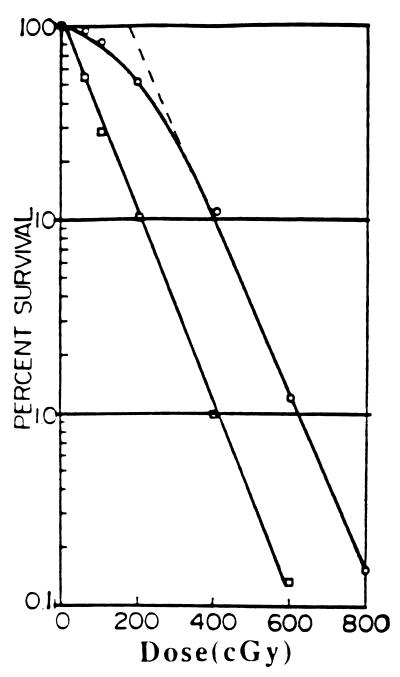
Figure 1.
A typical x-ray survival curve for the human HeLa cell (top curve) and demonstration of removal of the shoulder by caffeine (lower curve) to produce a linear curve with approximately the same slope as the limiting slope of the curve without caffeine (28). DL0, the mean lethal dose is obtained from this slope. DR0, the maximum dose that can be repaired is obtained from intersection of the top curve with the ordinate (survival = 100%). It can also be approximated as the interval between the two curves in the region where they are parallel.

