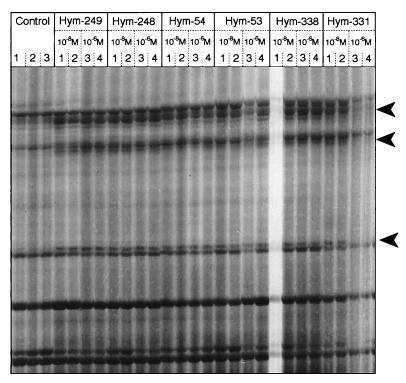
Figure 2.
DD-PCR analysis for changes in gene expression produced in hydra by the six LWamide peptides. The peptide treatment was carried out for 4 h in the presence of 2% DMSO. Controls were treated with 2% DMSO for 4 h. Arrowheads indicate bands present at higher intensities in lanes for peptide-treated animals than in lanes for control animals. The primers used for reverse transcription–PCR were 5′-d(T12AG)-3′ and 5′-d(GACCGCTTGT)-3′.

