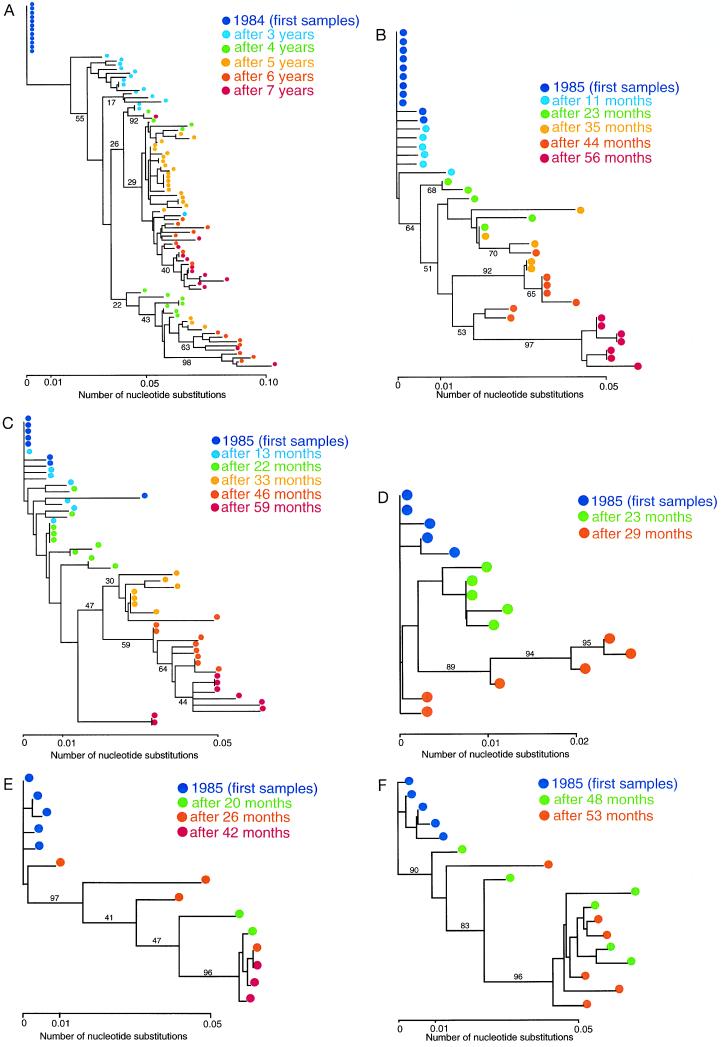
Figure 1.
Phylogenetic trees of HIVs within single hosts. Clones are shown by colored dots according to their sampling time. Bootstrap probabilities (25) for major clusters are also shown by percentages (%). (A) Phylogenetic tree of HIVs periodically sampled from patient A (20) using a 234-nt sequence. (B) Phylogenetic tree of HIVs periodically sampled from patient B (21) using a 183-nt sequence. (C) Phylogenetic tree of HIVs periodically sampled from patient C (21) using a 183-nt sequence. (D) Phylogenetic tree of HIVs periodically sampled from patient D (22) using a 332-nt sequence. (E) Phylogenetic tree of HIVs periodically sampled from patient E (22) using a 335-nt sequence. (F) Phylogenetic tree of HIVs periodically sampled from patient F (22) using a 332-nt sequence.

