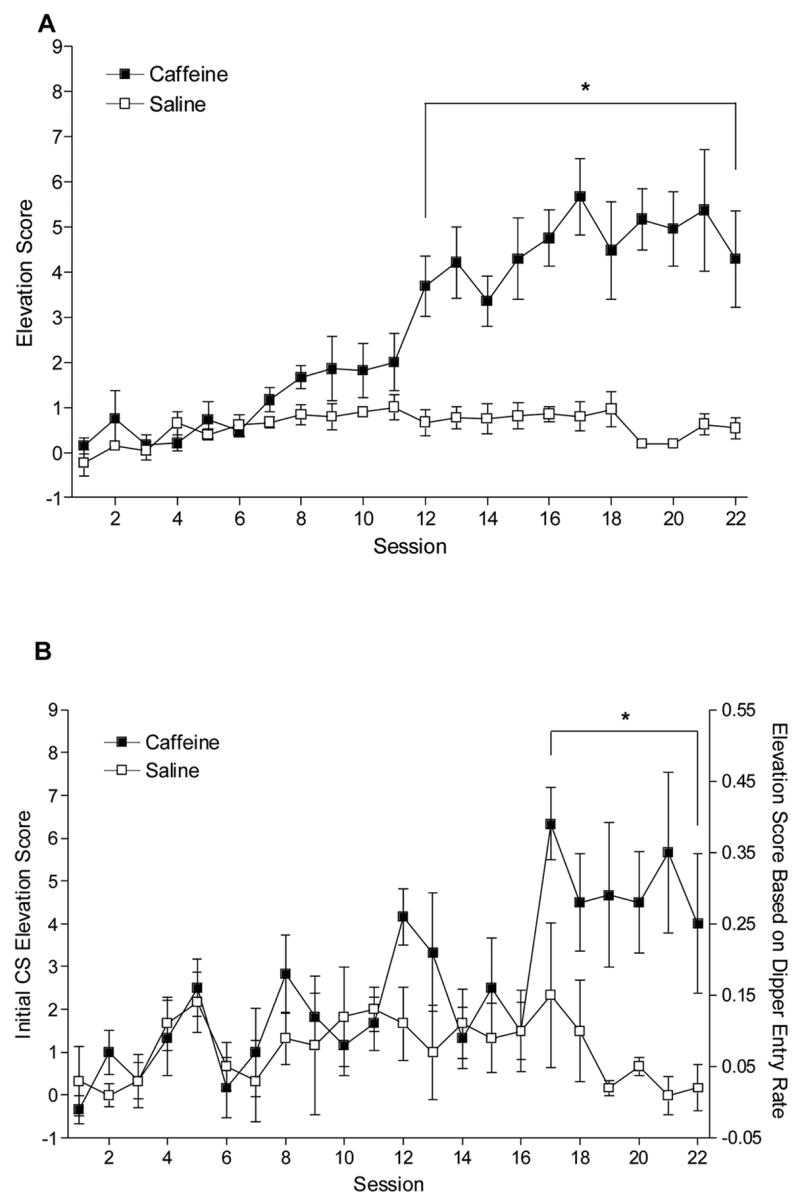
Figure 1.

Panel A shows the mean elevation scores (±1 SEM) for acquisition of the caffeine positive feature in Experiment 1. Panel B shows acquisition using the first elevation scores. The left axis shows elevation scores, and the right axis shows the same elevation score based on dipper entries per s (±1 SEM). For both panels, * indicates a significant difference between the corresponding caffeine and saline session, P<0.05.
