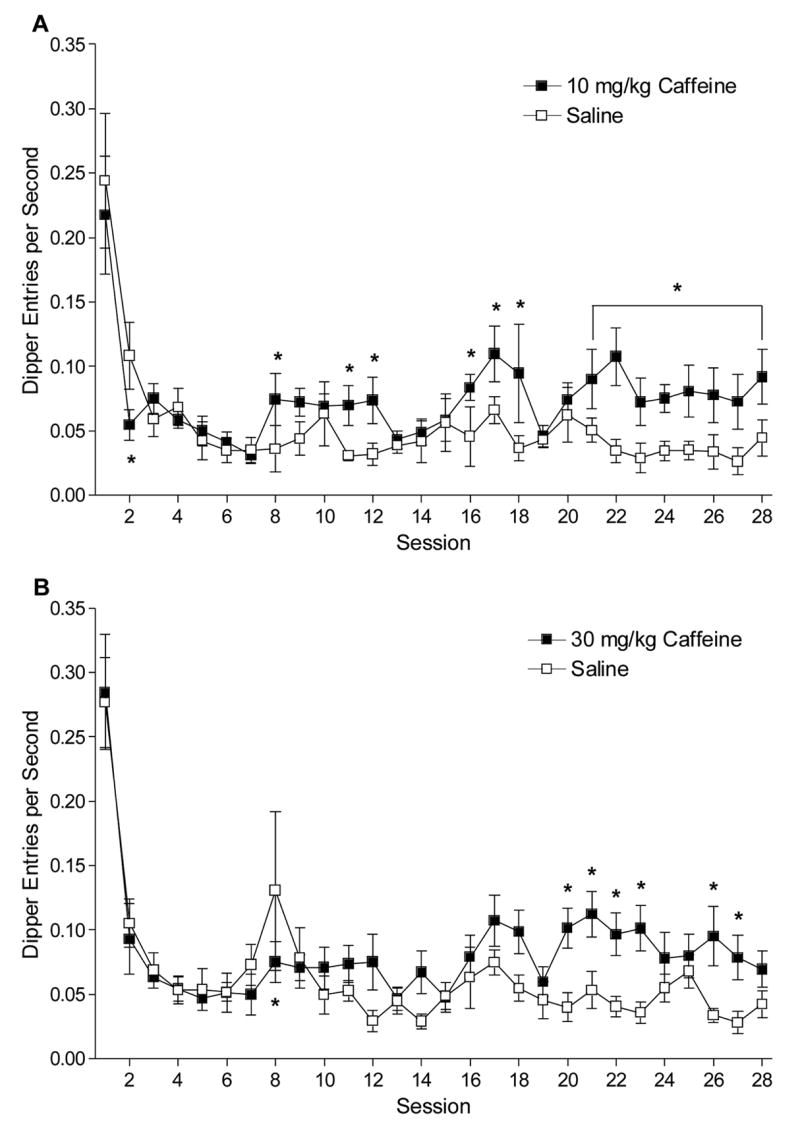
Figure 4.

Panel A shows the dipper entry rates (±1 SEM) for acquisition of the 10 mg/kg caffeine CS (Experiment 2a). Panel B shows the dipper entry rates (±1 SEM) for acquisition of the 30 mg/kg caffeine CS (Experiment 2b). For a rat in this experiment, 2 caffeine sessions were given that should have been saline sessions. These 2 caffeine sessions were not included in analysis, but to prevent loss of all data in the repeated measures ANOVA, saline values were generated by averaging the saline responding of the sessions before and after the missed saline sessions. For both panels, * indicates a significant difference between corresponding caffeine and saline session, P<0.05.
