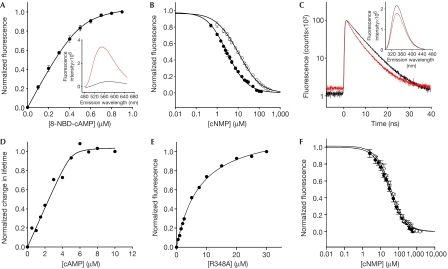
Figure 3.
Ligand binding to the CNBD protein by fluorescence spectroscopy. (A) Increase of 8-NBD-cAMP fluorescence (emission at 550 nm) on binding to the CNBD protein (0.5 μM). 8-NBD-cAMP fluorescence in the absence of the CNBD protein was subtracted. The solid line represents a nonlinear least-squares fit to ΔF=RL · x (equation (3), see supplementary information online). The KD value was 17.6 nM. Inset: emission spectrum of 8-NBD-cAMP (1 μM) in the absence (black) and presence (red) of CNBD protein (1 μM). (B) Competition between cAMP (closed circles) or cGMP (open circles) and 8-NBD-cAMP (1 μM) for binding to the CNBD (1 μM). Solid lines represent a nonlinear least-squares fit to ΔF=RLf · x (equation (7), see supplementary information online). The KD values were 73.5 nM (cAMP) and 296.9 nM (cGMP). (C) Decay of fluorescence of the tryptophan (Trp) residue of CNBD (5 μM) in the absence (black) and presence (red) of cAMP. Absolute values of lifetime were as follows: 0 μM cAMP (A1=12,252; τ1=6.778 ns; A2=3,133; τ2=2.035 ns; τ̄=6.357 ns); 10 μM cAMP (A1=10,999; τ1=6.258 ns; A2=3,889; τ2=2.185 ns; τ̄=5.674 ns). Inset: emission spectrum of Trp in the absence (black) and presence (red) of cAMP. CNBD concentration was 5 μM. (D) Normalized changes in fluorescence lifetime of Trp as a function of cAMP concentration. The solid line represents a nonlinear least-squares fit to equation (3) (supplementary information online). The KD value was 80 nM. (E) Increase of fluorescence of 8-NBD-cAMP (0.5 μM) on binding to increasing concentrations of the mutant CNBD (R348A). The KD value was 7.3 μM. (F) Competition between cAMP or cGMP and 8-NBD-cAMP for binding to mutant CNBD (R348A, 3 μM). The KD values were 22.9 μM (cAMP) and 27.7 μM (cGMP). CNBD, cyclic nucleotide-binding domain.

