
Figure 1.
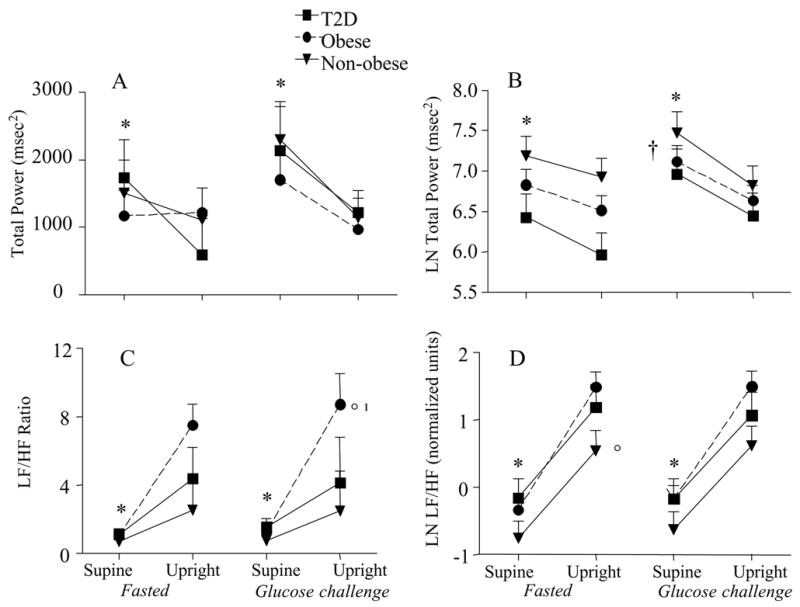
Total power and the LF/HF ratio for each group in the supine position and in response to tilt. The data is also presented in the fasted and glucose challenged condition. The left panel represents the raw data and the right panel is the natural log. mean±SE, *P<0.01supine vs. upright; ¹P<0.05 tilt by group interaction; °P<0.05 between groups; †P<0.000 interaction between glucose challenge and position