
Figure 3.
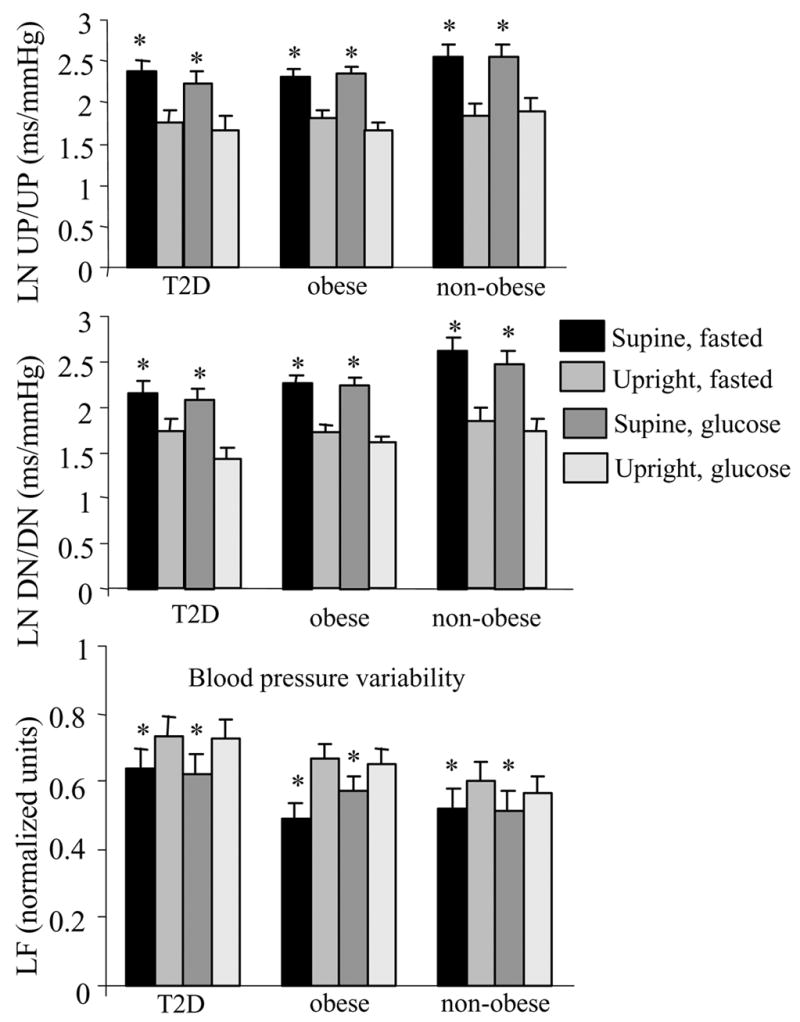
Spontaneous baroreflex sequences expressed as natural logarithms (LN) for each group. Sequences of concurrent increases in SBP and R-R intervals were defined as “up sequences” (UP/UP), whereas sequences of concurrent decreases in SBP and R-R intervals were defined as “down sequences” (DN/DN). UP/UP and DN/DN were calculated as the slopes of the regression lines between SBP and R-R intervals. The lower panel represents the LF data for blood pressure variability for each group and each condition. mean±SE, *P<0.01supine vs. upright