
FIGURE 2.
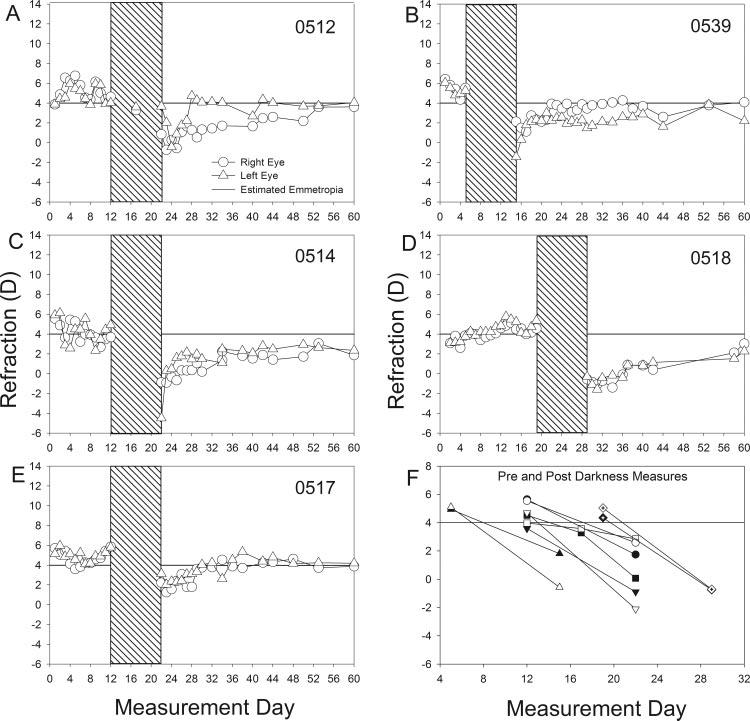
(A-E) Refractive measures of the left and right eyes of each animal in the dark-treatment group starting at 16 days of VE (measurement day 1). All daily measures are shown without averaging. Hatched region: the timing of the 10-day dark-recovery period. (F) Refractive measures of the left and right eyes of each animal before and after dark treatment. Lines connect the pre- and postdarkness measures. Each data point is the mean of the last 2 days before or the first 2 days after darkness. A different symbol is used for each animal. Filled symbols: right eye; open symbols: left eye. Horizontal line at 4 D: estimated emmetropia as measured with the autorefractor.