
FIGURE 4.
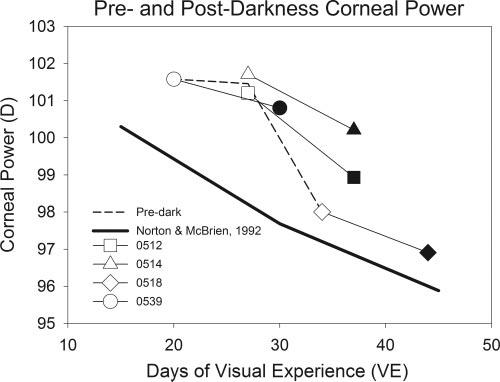
Corneal power measures in dark-treatment animals (average of left and right eyes) compared with normal corneal power at comparable ages and average predarkness values. Open symbols: predarkness measures; filled symbols: postdarkness measures. A different symbol is used for each animal. Normal data are the values from a previous study in which a different keratometer was used.6 Dashed line: average pretreatment corneal powers.