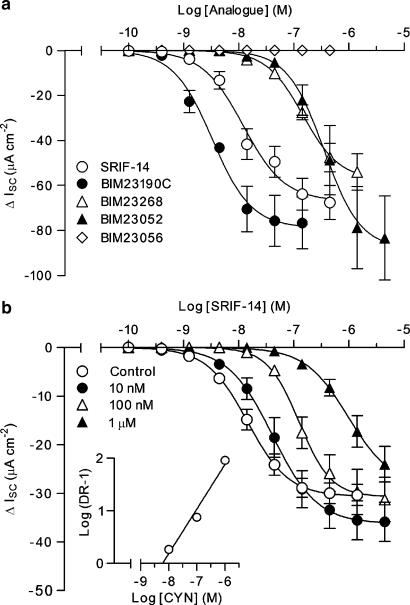
Figure 4.
Responses to SRIF-14 and BIM agonists in rat descending colon mucosa. In (a), pooled cumulative concentration–response curves for SRIF-14 (n=18), BIM23190C (n=3–5), BIM23052 (n=4), BIM23268 (n=6) or BIM23056 (n=3) produced the pEC50 values presented in Table 2. (b) The effect of CYN154806 pretreatment (CYN; 10 nM–1 μM; n=5) on the SRIF-14 concentration–response curve (antagonist pEC50 values are quoted in the text) in tetrodotoxin (100 nM)-pretreated tissues. The resulting Schild plot (inset) had a slope of 0.85 and a pA2 value of 8.2. SRIF, somatotrophin release inhibiting factor.

