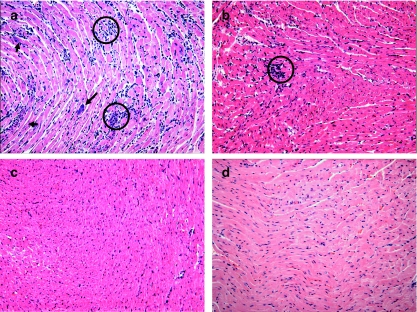
Figure 3.
Histological patterns of heart sections of mice infected with T. cruzi 1.0 × 10³ BT mouse−1 and treated with (a) PBS, (b) Ru(NO)isn or (c) Ru(NO)imN during 15 consecutive days or (d) non-infected mice. On the 15th day after infection, the mice were killed and their hearts processed for H&E staining. Note the intensity of the inflammatory process with mononuclear cell infiltrates and necrosis in (a) but not in (c) or (d). Arrows indicate the nests of amastigotes and circles indicate inflammatory infiltrate. Photomicrographs are representative of three independent experiments with similar results. Final magnification: × 200. BT, bloodstream trypomastigote; H&E, hematoxylin and eosin; PBS, phosphate-buffered saline.

