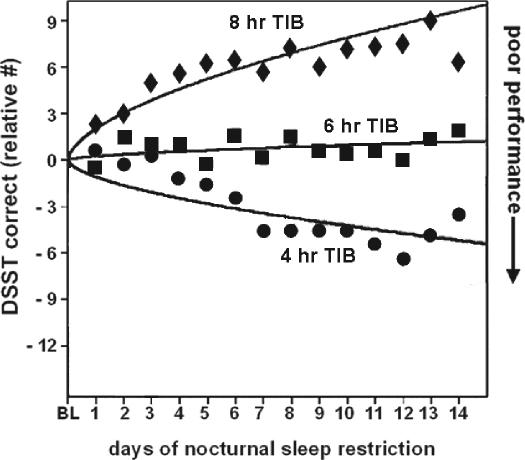
Figure 3.
Digit symbol substitution task (DSST) performance responses to varying doses of daily sleep across 14 days. Data from n = 35 subjects (8h condition n = 9, 6h condition n = 13 and 4h condition n = 13). Mean DSST per day (07:30–23:30), measured at 2-h intervals expressed relative to baseline (BL). The curves represent statistical nonlinear model-based best-fitting profiles of the DSST performance response to sleep loss. Adapted from Van Dongen et al.12

