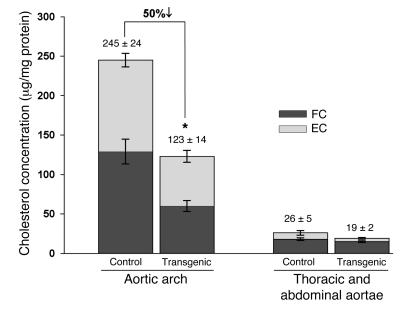
Figure 4. Aortic lesions in Ldlr–/–CEHTg mice have significantly lower EC than lesions in Ldlr–/– mice fed a Western diet for 16 weeks.
Aortae (from aortic sinus to the iliac bifurcation) were isolated, opened, and pinned to expose the lesions. After fixing in buffered formaldehyde for 24 hours, the aortic arch was cut along the line as shown in Figure 3 and lipids extracted from the resulting 2 pieces corresponding to the arch and the thoracic and abdominal aortae. FC and EC concentration (μg/mg protein) was determined as described in Methods. The concentration of total cholesterol is indicated at the top of the bars. Data are expressed as mean ± SEM (n = 6). *P < 0.004.

