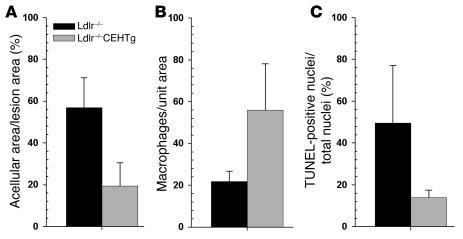
Figure 6. Decreased necrosis/apoptosis of macrophages in lesions from Ldlr–/–CEHTg compared with Ldlr–/– mice.
H&E-stained sections were used to determine the percentage of acellular area/necrotic area of the lesions (A), and the number of macrophages in the lesions (B) as well as the percentage of TUNEL-positive nuclei/total nuclei (C) were determined as described in Methods. Data are expressed as mean ± SEM for 5 mice per genotype, and 3 lesions were analyzed per animal. P = 0.00002 (A); P = 0.001 (B); P = 0.000008 (C).

