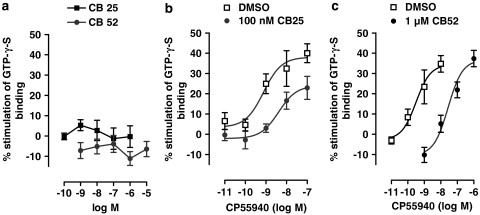
Figure 4.
(a) The effect of CB-25 (n=6) or CB-52 (n=6) on the level of [35S]GTP-γ-S binding to CB2-transfected CHO cell membranes and the effect of (b) 100 nM CB-25 (n=3–4) or (c) 1 μM CB-52 (n=3–4) on the mean log concentration–response curve of CP55940 for stimulation of [35S]GTP-γ-S binding to CB2-transfected CHO cell membranes. Each symbol represents the mean percentage increase in [35S]GTP-γ-S binding ±s.e.

