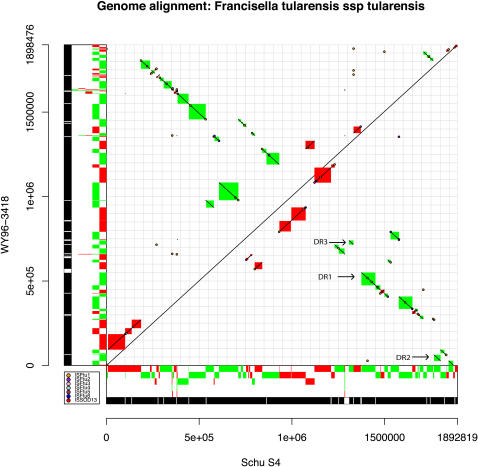
Figure 3. Dot plot comparison of MUMmer nucmer output [26] between Francisella tularensis subsp. tularensis strains Schu S4 and WY96.
Plot generated from MUMmer coords file output using script written for R. Shared blocks of 1.5 Kb or greater were plotted as diagonal lines outlined in red (forward matches) and green (inversions). Positions of ISFtu elements (transposons) were plotted as colored spots (see legend). Red and green blocks on the axes correspond to forward and inversion matches, respectively, to the other genome, and different levels show overlapping matches. The black and white bars on each axis show overall matching regions (black) and gapped regions of no match (white). The two direct repeats (DR) diagonals are labeled DR1, DR2 along with the partial DR3 repeat (Table S4).

