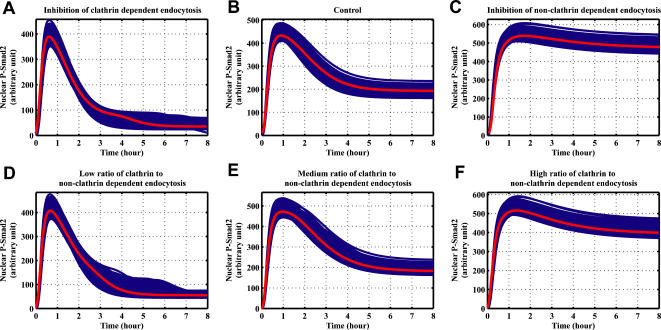
Figure 6. Computational simulations of the time course of nuclear phosphorylated Smad2 by the inhibition of different receptor endocytosis in 1000 parameter sets estimated by constraint-based modeling method.
The red lines refer the simulations for the parameter values listed in Table 1. Blue lines correspond to the 1000 parameter sets with the estimated parameter values listed in the Table S1. (A) Same parameter values as those in parameter sets with the exception that clathrin dependent internalization rate constant is decreased by a factor of 10: kiEE = 0.033 min−1. (B) Same parameters values as those in parameter sets. (C) Same parameter values as those in parameter sets with the exception that non-clathrin dependent internalization rate constant is decreased by a factor of 10: kiCave = 0.033 min−1. (D) Same parameter values as those in parameter sets with the exception that kiEE is decreased by a factor of 10 and kiCave is decreased by a factor of 2: kiEE = 0.033 min−1, kiCave = 0.165 min−1. (E) Same parameter values as those in parameter sets with the exception that kiEE and kiCave are decreased by a factor of 10: kiEE = 0.033 min−1, kiCave = 0.033 min−1. (F) Same parameter values as those in parameter sets with the exception that kiEE is decreased by a factor of 2 and kiCave is decreased by a factor of 10: kiEE = 0.165 min−1, kiCave = 0.033 min−1.

