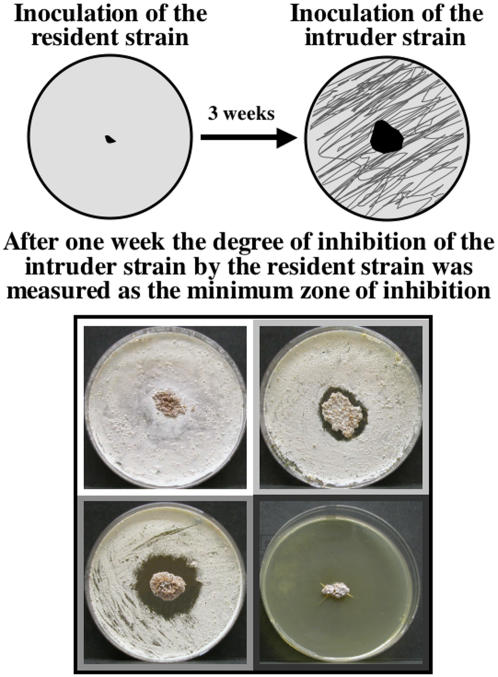
Figure 1. Schematic diagram of the assessment of actinomycete antagonism.
The resident actinomycete was inoculated in the center of a Petri dish and left at room temperature for three weeks, after which a suspension of the intruder actinomycete was inoculated to the entire unoccupied Petri dish area (top). One week after the intruder strain was applied, the minimum diameter of the resident strain and the minimum zone of inhibition (zoi) imposed on the intruder strains were measured. The bottom section of the figure shows four examples of actinomycete-actinomycete reactions, with no antagonism displayed by the residing clone towards the intruding actinomycete (top left), intermediate levels of antagonism with slight to strong inhibition (top right and bottom left), and to complete inhibition of the intruder by the residing strain (bottom right). Pictures are framed with colors according to the size of the zoi: white = no inhibition, light grey = 0.01–0.29 cm, grey = 0.30–0.59 cm, darker grey = 0.60–0.89 cm, and darkest grey>0.90 cm.

