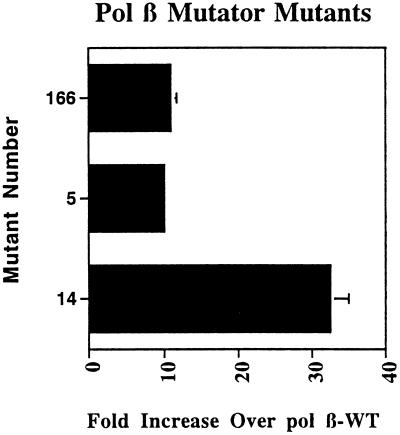
Figure 2.
pol β mutator mutants. The -fold increase over pol β-WT represents the spontaneous mutation frequency of the mutant divided by that of the pol β-WT. Each bar represents data averaged from three independent experiments. The mutant number refers to the pol β mutant cDNA which is present on the pβL vector and contained within the SC18–12 strain. Error bars represent standard deviations.

