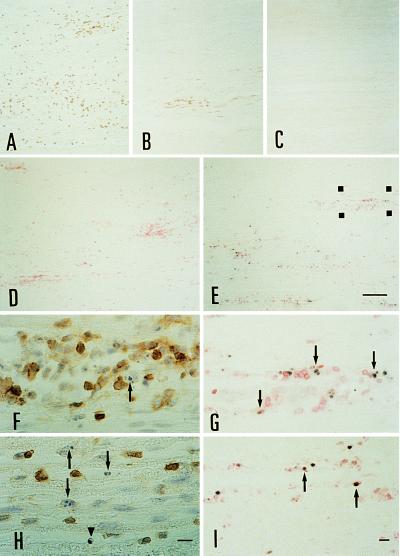
Figure 2.
T cell infiltration in AT-EAN on day 7 in (A) the ovalbumin control group, (B) the 1× 100 μg of rhP2 group, and (C) the 2× 500 μg of rhP2 group. (D and E) Double-labeling of apoptotic T cells in the sciatic nerve. Nuclei with fragmented DNA are labeled black by IST followed by anti-T cell immunochemistry visualized with fast red salt. Microphotographs show representative sections from control rhP0 animals (D) and rhP2-treated recipients (E), which were treated once on days 6 and 7 and killed 6 h later. Note the high number of apoptotic nuclei occurring in the sciatic nerve of rhP2-treated animals. (Bar for A–E = 100 μm.) (G) The region marked in E at higher magnification. Apoptotic T cells are indicated by arrowheads. (I) Apoptotic fragments (black) are engulfed by macrophages labeled with ED 1 (red). (F and H) T cells displaying typical nuclear changes characteristic for apoptosis (arrows). Some cells still have a preserved membrane signal (arrowhead). F is a higher magnification of the region marked in E stained on a serial section. (Bars for F–I = 10 μm.)

