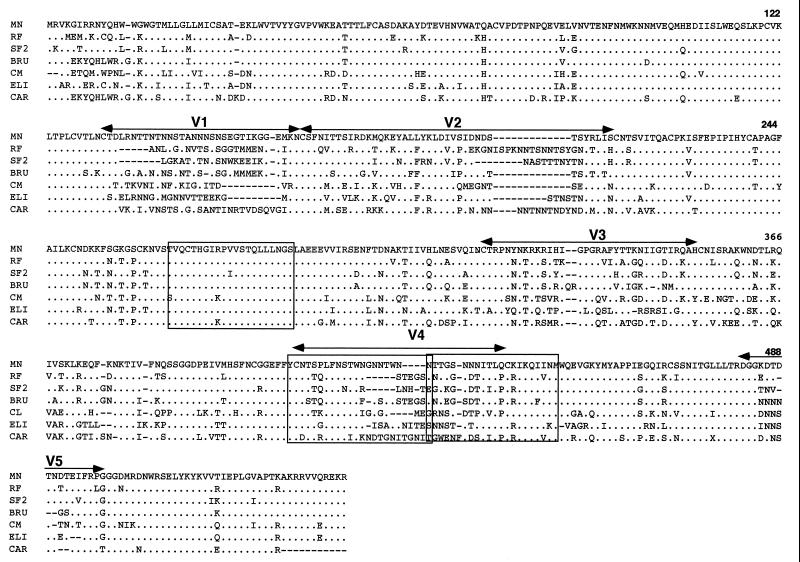
Figure 3.
Sequence comparison of the gp120 molecules from different isolates. Shown are the locations of the variable regions. The sequences corresponding to the peptides that inhibit gp120 SAg binding are boxed. Gaps are introduced to maximize homology and dots indicate homology. Numbering is according to Ratner et al. (10).

