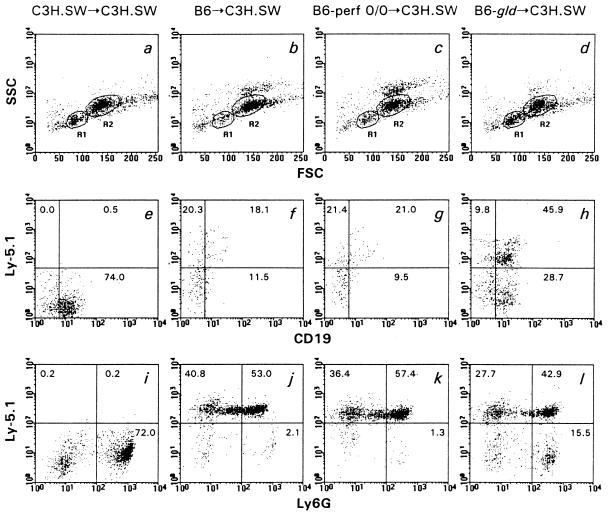
Figure 3.
Light scatter (a–d) and immunofluorescent analysis (e–l) of recipient bone marrow cells 39 days after BMT with 2.5 × 10⁶ syngeneic, wild-type allogeneic, perforin-deficient allogeneic, or FasL-defective allogeneic T cells. Marrow cells were stained with anti-CD19–FITC (FL1) and anti-Ly-5.1–biotin plus avidin–PE (FL2), and analyzed within the lymphocyte gate region (R1). Marrow cells were also stained with anti-Ly6G–FITC (FL1) and anti-Ly-5.1–biotin plus avidin–PE (FL2), and analyzed within the granulocyte/monocyte gate region (R2).

