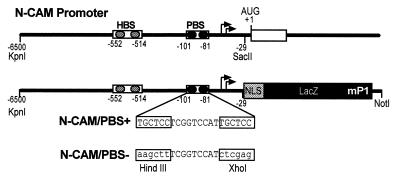
Figure 5.
Schematic representation of the 5′ flanking region of the mouse N-CAM gene showing N-CAM/PBS+ and N-CAM/PBS− transgenes. Arrows represent transcription initiation sites. The site of translation initiation is designated as +1. The sequence of the PBS, and the base pair substitutions made in the PBS-1 and PBS-2 in N-CAM/PBS− are indicated. The location of the HBS in the N-CAM promoter is also shown.

