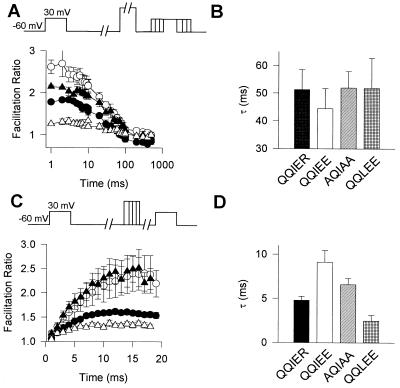
Figure 4.
Effects of mutations in the QXXER motif of the α1A subunit on the rates of onset and reversal of G protein modulation in the presence of GTP[γS]. (A) Rate of onset. A 4-ms test pulse (test 1) to +30 mV was applied from the holding potential of −60 mV. After 1s, a 10-ms conditioning prepulse to +100 mV was applied to completely relieve G protein inhibition, the cell was repolarized to −60 mV for a period of 1–500 ms, and a second 4-ms test pulse (test 2) to +30 mV was applied. Tail current of the second test pulse was divided by the first test pulse, and means ± SEM were plotted versus the time interval at −60 mV between prepulse and test pulse 2. •, α1A/QQIER; ○, α1A/QQIEE; ▴, α1A/AQIAA; and ▵, α1A/QQLEE. (B) The time courses of G protein action (A) were fitted with one exponential, and the corresponding time constants were plotted. (C) Rate of reversal. A 4-ms test pulse (test 1) to +30 mV was applied from the holding potential of −60 mV. After 1s, a conditioning prepulse to +100 mV for a period of 1 to 18 ms was applied, the cell was repolarized to −60 mV for 10 ms, and a second 4-ms test pulse (test 2) to +30 mV was applied. The tail current of the second test pulse was divided by the first test pulse, and means ± SEM were plotted against time interval at +100 mV. •, α1A/QQIER; ○, α1A/QQIEE; ▴, α1A/AQIAA; and ▵, α1A/QQLEE. (D) Time courses for reversal of G protein action were fitted with one exponential and the corresponding time constants were plotted.

