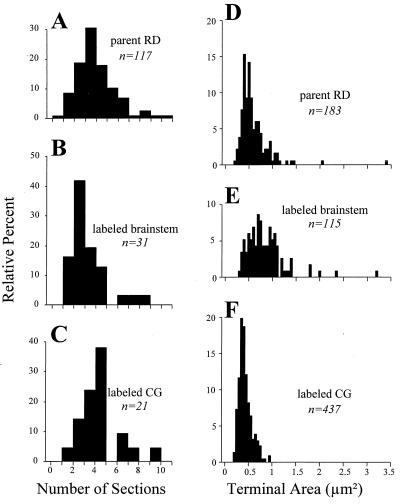
Figure 2.
Measurements of synaptic terminals for parent RD terminals (i.e., the larger population from which cholinergic brainstem and corticogeniculate terminals are drawn), brainstem terminals labeled for ChAT or BNOS, and corticogeniculate terminals labeled with biocytin. (A–C) Frequency histograms indicating the extent of the synaptic contact zones. For each of the terminals, the contact zone was serially reconstructed to derive the number of serial sections needed to contain the reconstructed synaptic contact zone. (D–F) Frequency histograms for each terminal type showing their cross-sectional areas. The numbers of terminals in each sample are indicated, and the terminals represented in A–C are a subset of those in D–F.

