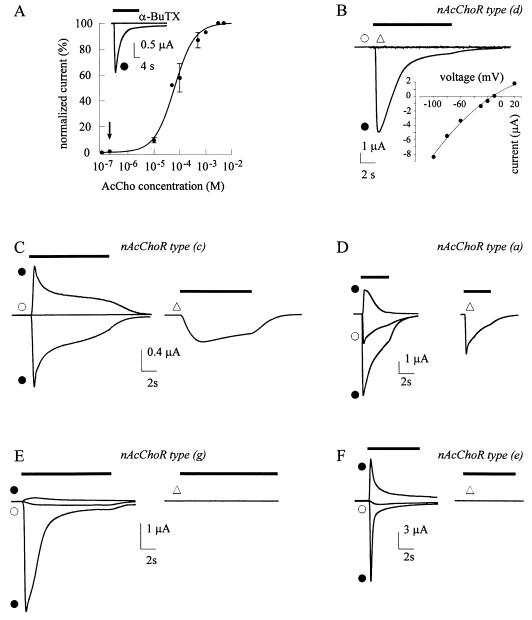
Figure 2.
Membrane currents from oocytes injected with a mixture of cDNAs (ratio 1:1) encoding the WT α7 and L247T α7 subunits. (A) AcCho dose–IAcCho response relationship best fitted to Equation 1. The peak AcCho currents were normalized to that evoked by 5 mM AcCho (IAcCho mean peak amplitude: −3.8 μA). Each point represents the mean ± SD (n = 6; four donors). Data fits to a function consisting of the sum of two or three Eq. 1 were not statistically different from the fit with a single Hill equation and minor number of parameters (F-distribution test; ref. 13). Data derived from six mixture-injected oocytes expressing mainly c, d, e, f, g or h type nAcChoRs (Table 1). Inset shows an example of IAcCho blocked by α-BTX (100 nM) in one of the six oocytes examined. (B) Example of IAcCho elicited by activation of mainly d type receptor population (see Table 1) and corresponding I–V relation. Note the inhibitory action of 5HT, the lack of response to 0.2 μM AcCho, and the slow desensitization. (C) Example of IAcCho evoked by the activation of mainly c type receptor population. Note the lack of response to 0.2 μM AcCho, the outward IAcCho at +20 mV (left), and the inward current elicited by 5HT. (D) Example of currents evoked by activation of a type nAcChoRs. Note a measurable IAcCho at 0.2 μM AcCho and outward IAcCho at +20 mV (left) with I0.2/I100 = 38%. (E) Superimposed currents (left) and lack of 5HT response in an oocyte that expressed a g type nAcChoR population. Note relatively small outward IAcCho at +20 mV. (F) Another oocyte expressing type e nAcChoRs population. Note the fast desensitizing inward IAcCho, outward IAcCho at +20 mV (superimposed) with differences in the desensitization and the lack of response to 5HT (right). Bars, symbols and I–V curve, as Fig. 1. B, D, and E, oocytes from same donor; C and F, from two other donors. Note differences in the current desensitization at positive potentials in C–F.

