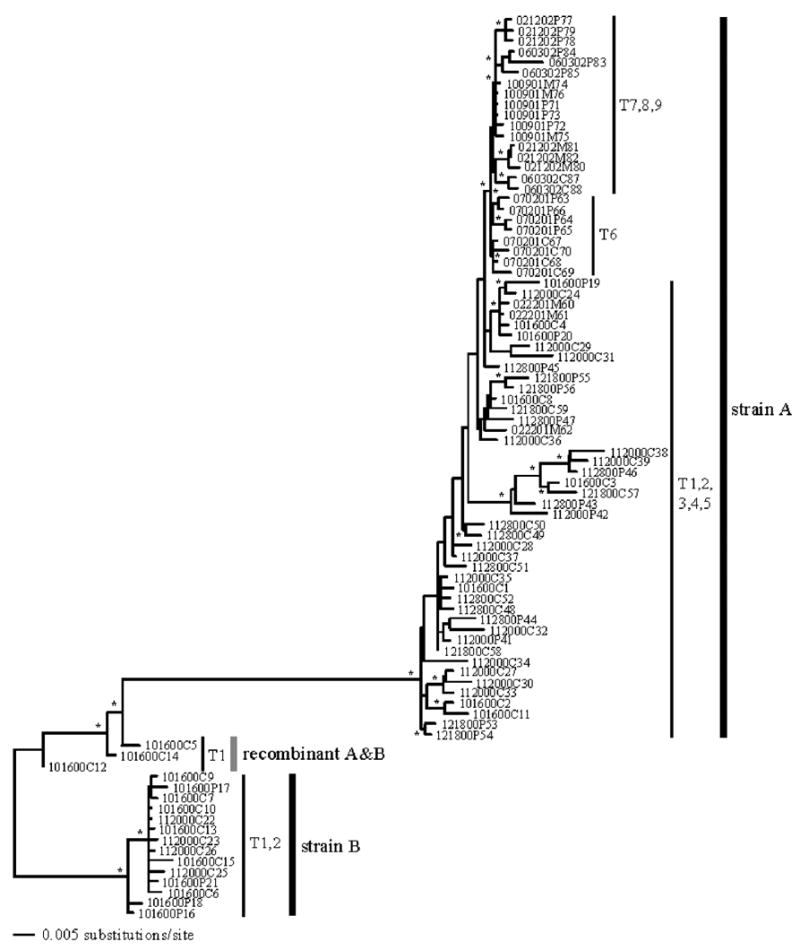
FIG. 1.

Maximum likelihood estimate of phylogenetic relationships. A mix model Bayesian analysis generated almost the same relationships. Clades supported by bootstrap values ≥ 70% and/or posterior probabilities ≥ 0.95 are indicated with an asterisk (*) on the branches. Branch lengths are shown proportional to the amount of evolutionary change. The sequence labels are described in Table 1 and sequence labels are coded by collection date.
