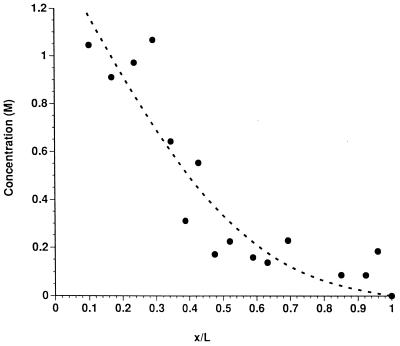
Figure 1.
The concentration profile of CP transport across
human SC (subject A) in vivo after exposure of the skin
to an aqueous solution of the chemical for 15 min. The values on the
abscissa (x/L) are calculated from the
ratio
 ,
where Mi is the SC mass removed by the
ith tape-strip and
Σi=1nMi = MT, the
total SC mass removed by all n tape-strips combined.
Nonlinear regression was used to obtain the best fit of Eq.
1 (dashed line; r2 = 0.84) to the
data. From this analysis, it can be deduced that
D/L2 = 9.90 × 10⁻⁵
s−1 and K = 5.5.

