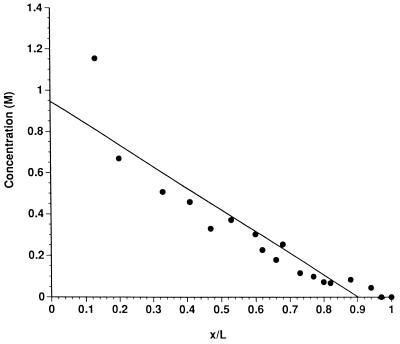
Figure 2.
The concentration profile of CP across human SC (subject A) after exposure of the skin to an aqueous solution of the chemical for 1 h. The values on the abscissa (x/L) are calculated as described for Fig. 1. The slope and intercept of the line of linear regression through the data are −1.05 M and 0.95 M, respectively. The values predicted from the 15-min exposure data (Fig. 1) are −1.43 M and 1.43 M, respectively.

