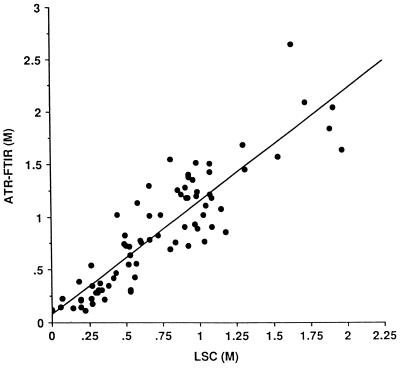
Figure 5.
Correlation between the concentrations of CP in the SC, after a 15-minute exposure to an aqueous solution of the chemical, as measured by ATR-FTIR spectroscopy and by liquid scintillation counting (LSC). The accumulated data from four different subjects (78 measurements) are shown. The line of linear regression drawn through the data is y = 1.07 x + 0.08 (R2 = 0.796, P < 0.0001). The values of the slope and intercept are not significantly different from 1 and 0 (P > 0.05), respectively.

