
Fig. 1.
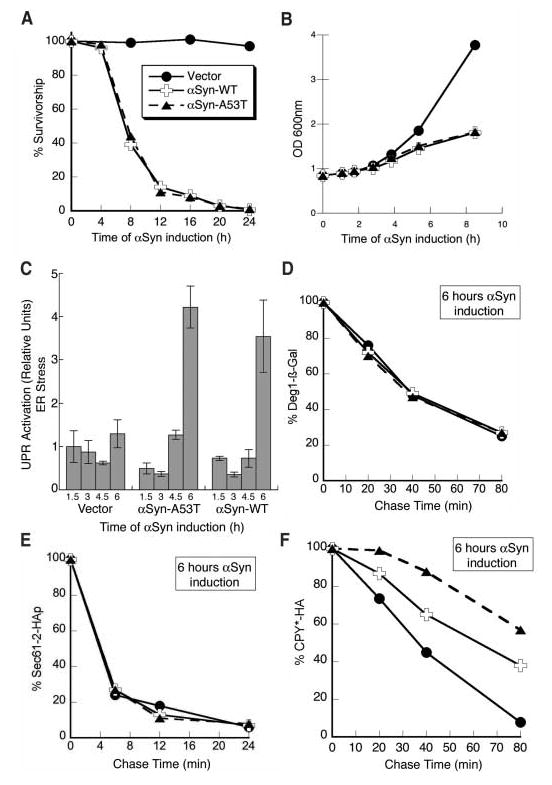
Expression of αSyn causes cell death and ER stress and impairs ERAD. (A) Survivorship curve during αSyn induction. After induction of αSyn-WT, αSyn-A53T expression, or control cells (Vector), cells with an optical density at 600 nm (OD600nm) of 1 were harvested and treated as described (24). Colony-forming units were determined and converted to relative percentages. (B) Growth curve during αSyn induction. After induction, the OD600nm for each sample was measured at the indicated times. (C) Cells induced for expression of αSyn-WT, αSyn-A53T, or control cells (Vector) were harvested at the times indicated; the level of UPR activation was then determined and plotted as relative units of ER stress. The degradation rate of Deg1-βGal (D), Sec61-2p (E), and CPY* (F), after 6 hours of either αSyn-WT or αSyn-A53T expression, was determined by pulse-chase immunoprecipitation as described (24) and compared to that of control cells (Vector).