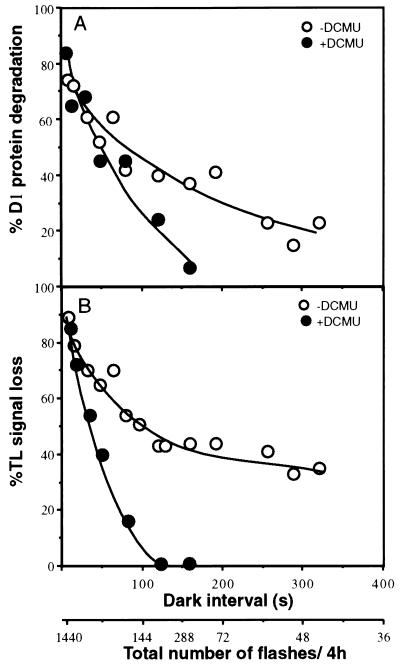
Figure 4.
Relation between the flash induced photoinactivation and degradation of the D1 protein and increasing the dark interval between the flashes. Thylakoids were exposed for 4 h to light flashes in absence or presence of DCMU. The dark intervals between the flashes varied from 8 to 320 s, corresponding to a total of 1800 to 45 flashes delivered per sample, respectively. The samples were analyzed for D1 protein content (A) and TL signal (B). • and ○, Thylakoids with or without addition of DCMU, respectively. The data represent percent of a dark control.

