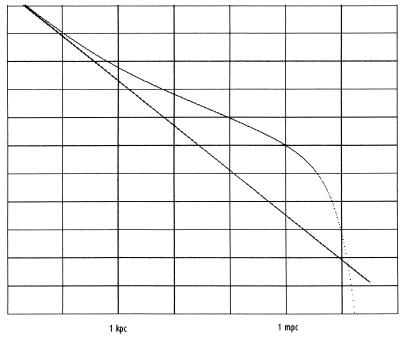
Figure 1.
Log–log graph of Eq. 3 showing the effect of diffusion on the force of attraction compared with the inverse square law. Eq. 3: r−2 (1 + br/p)erfc[r/a(pct)0.5] is the upper curve using the values a = 1.1, b = 3.1, p = 5 kpc and r is shown in Mpc. Numerically, it becomes r−2(1 + 600r)erfc(r/3) because (pct)0.5 is 7.5 E24 cm at the present time, assuming diffusion has been occurring for 1.2 E10 years. Below this curve is a line for the inverse square law. The index lines are spaced at factors of 10 with the vertical scale half of the horizontal to accommodate the 1.0 E11 range. Note that, at the maximum, the diffusion curve lies more than two orders of magnitude above the inverse square line.

