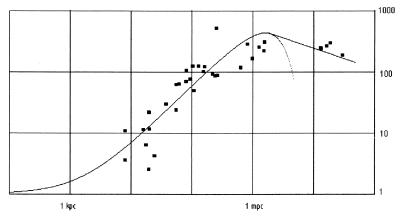
Figure 2.
Comparison of the observed excess gravitational force for galaxies and clusters of galaxies with the prediction of the gravitational diffusion model. The lower curve is Eq. 3, using the numerical values described in the legend of Fig. 1, without the 1/r2 factor so that it directly represents the excess gravitational force. The upper curve on the right is based on calculations of the excess force on a test mass immediately external to a large distributed mass for a diffusion case with a mean free path of 5 kpc, as described in the text. The principal part of the data has been extracted from figure 2 from the study by Bahcall et al. (3). The lower points are the median values for Sa, Sb, and Sc galaxies from figure 5 from the study of Rubin (4). Reference is to the original papers for the identification of the individual objects, which include spiral galaxies, elliptical galaxies, clusters, and superclusters.

