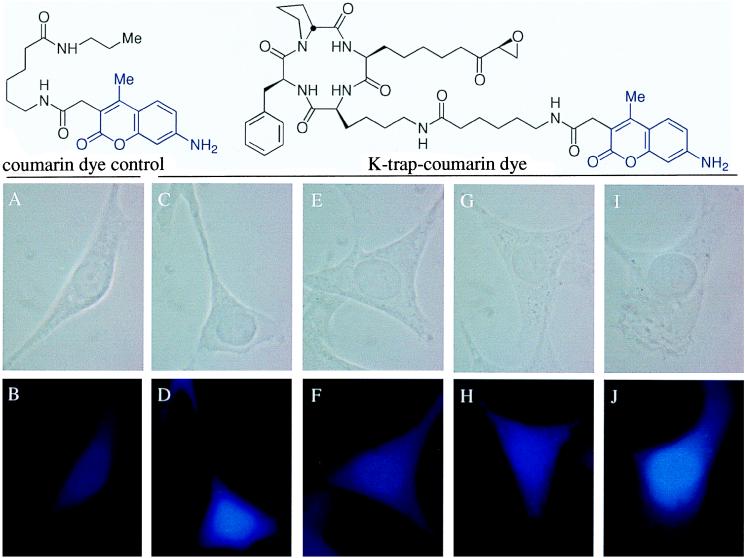
Figure 4.
Visualization of HDACs and HDAC binding in the nucleus of v-ras NIH 3T3 cells using a competition binding assay involving K-trap–coumarin dye and various detransformation agents. The staining was carried out as described in Material and Methods. Upper and lower photos were taken using phase-contrast and fluorescence microscopy, respectively. Coumarin dye excites at 345 nm with blue light. (A and B) Coumarin dye control. (C and D) K-trap–coumarin dye control. (E and F) K-trap–coumarin dye in cells pretreated with 23.5 μM depudecin. (G and H) K-trap–coumarin dye in cells pretreated with 0.1 μM trapoxin. (I and J) K-trap–coumarin dye in cells pretreated with 3.4 μM radicicol.

