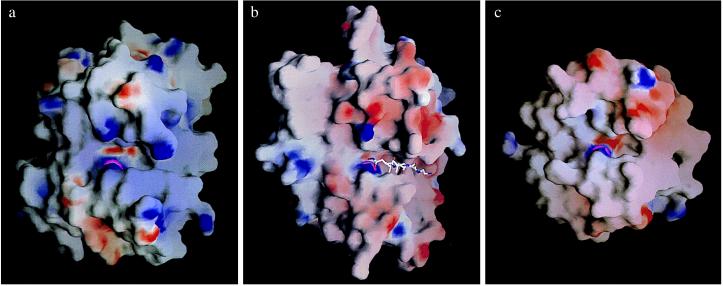
Figure 2.
Solid-surface representations of the catalytic domains of adamalysin II (6, 7) (a), TACE (b), and MMP-3 (d) (21). The electrostatic surface potentials are contoured from −20 (intense red) to 20 kBT/e (intense blue). The active-site clefts run from left to right, with the catalytic zinc atoms (pink spheres) in the centers. In TACE, the bound inhibitor is shown in full structure. Orientations are equivalent to Fig. 1. The figure was made with grasp (22).

