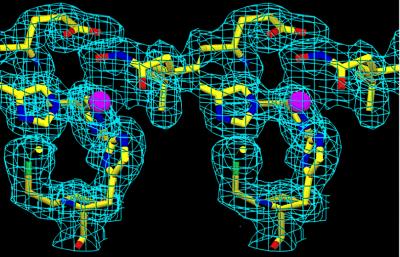
Figure 4.
Stereo section of the final 2.0 Å electron density around the catalytic zinc (pink sphere) superimposed with the final TACE model (with His-405 in the back, Glu-406 and the hydroxamic acid inhibitor moiety on top, His-409 to the left, and Met-435 and His-415 at the bottom). The average Zn—N or O distances are 2.3 Å. Orientation is similar to Fig. 1. Figure was made with turbo-frodo (17).

