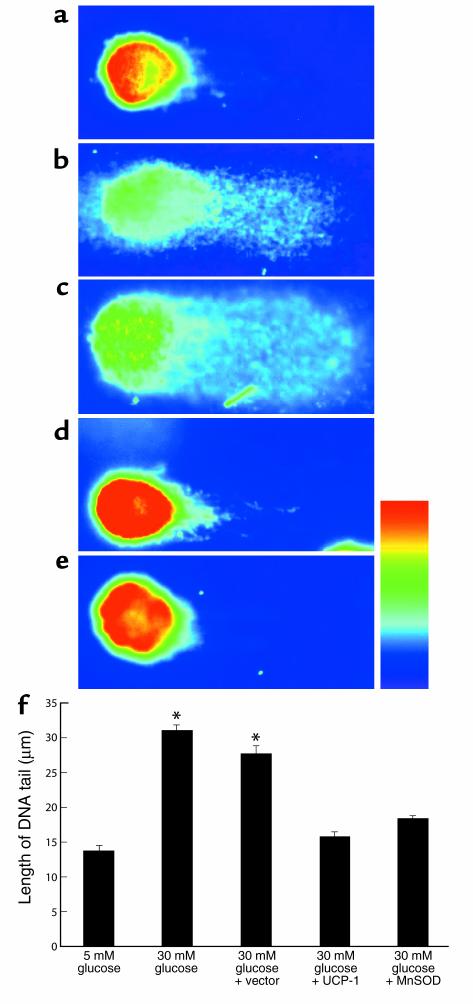
Figure 6.
Effect of hyperglycemia and genes that alter mitochondrial superoxide production on DNA strand breaks in BAECs. Cells were incubated in 5 mM glucose (a) or 30 mM glucose alone (b), or in 30 mM glucose plus either control (c), UCP-1–expressing (d) or MnSOD-expressing (e) adenoviral vectors. Fluorescent micrographs from single-cell electrophoresis assay. (f) Quantitation of DNA strand breaks from single-cell electrophoresis assay. Each bar represents the mean ± SEM of 40 cells for each incubation condition. *P < 0.01 compared with cells incubated in 5 mM glucose alone.

