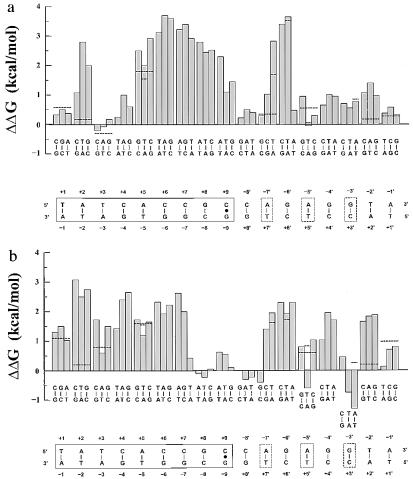
Figure 3.
(a) Relative free energy changes (ΔΔG) in the binding of λ-repressor to OR1 on base substitution. The figure shows the change in affinity (Kd) that results from each of the three possible substitutions at all 17 sites. The sequence shown at the bottom is that of OR1: the left half represents the consensus-half operator (solid box) and the right half represents the nonconsensus-half operator containing three nonconsensus bps at positions 3′, 5′, and 7′ (dashed boxes). The histogram gives the change in the free energy of binding caused by the indicated bp substitution. The dashed horizontal lines on the histogram that cross over three bars or one bar represent, respectively, the ΔΔG from the replacement of thymine with uracil in OR1 or the OR1 mutant (redrawn from ref. 10). (b) Analysis of the effects of substitutions on the binding of Cro to OR1 (c.f. a) (redrawn from ref. 11).

