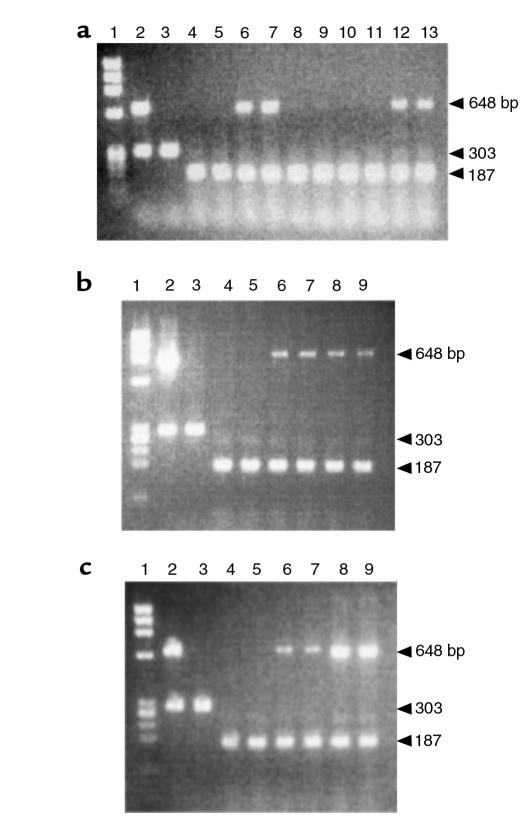
Figure 2.
Expression profile of the tTA and MMP-13* RNA by RT-PCR. (a) Amplification of MMP13* in each of the transgenic lines. Lane 1: φx174 Hae III MW markers; lane 2: PCR amplification of transgenic (line 6) genomic DNA; lane 3: PCR amplification of nontransgenic genomic DNA; lane 4: a wild-type mouse maintained on Dox; lane 5: a wild-type mouse off Dox; lanes 6–7, 8–9, 10–11, and 12–13: heterozygous lines 6, 8, 42, and 99 (4 weeks) removed from Dox at birth, respectively (duplicate). (b and c) Amplification of tTA (b) and MMP-13* (c) cDNA from total RNA. Lanes 1–5: same as in a; lanes 6–7: transgenic mouse (4 weeks) maintained on Dox (duplicate); lanes 8–9: transgenic mouse (4 weeks) removed from Dox at birth (duplicate). The 859-bp fragment and the 648-bp fragment represent the tTA RNA and the MMP-13* RNA, respectively. Each reaction was run using c-fos primers as an internal control, spliced mRNA yielding 187 bp, and unspliced mRNA 303 bp. Note, no bands were detected in corresponding lanes containing RNA for PCR that was not treated with M-MLV RT (data not shown). Moreover, PCR fragments were transferred to a nylon membrane and hybridized to a tTA or MMP-13 transgene-specific probe to verify the identity of the PCR product (data not shown).

